
 3
提交
4
提交完成
5
查看报告
6
评价
3
提交
4
提交完成
5
查看报告
6
评价
自定义题目重新选题
写作题目
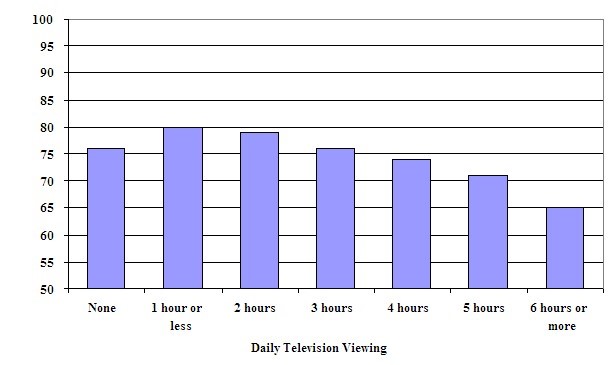
收起The bar chart below gives information about the average science test scores of Grade 8 students in relation to the number of hours they watch television each day. . Summarise the information by selecting and reporting the main features, and make comparisons where relevant. Write at least 150 words.
The bar chart below gives information about the average science test scores of Grade 8 students in relation to the number of hours they watch television each day. . Summarise the information by selecting and reporting the main features, and make comparisons where relevant. Write at least 150 words.


 喜欢
喜欢
 不喜欢
不喜欢
 无所谓
无所谓
 讨厌
讨厌
 专家在线
专家在线