
 3
提交
4
提交完成
5
查看报告
6
评价
3
提交
4
提交完成
5
查看报告
6
评价
自定义题目重新选题
写作题目
收起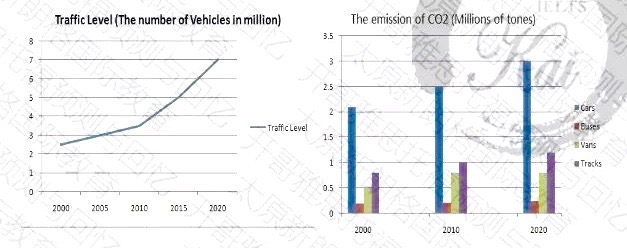
the chart and graph show the change in traffic condition and the emission of CO2 in England and Wales between 2000 and 2020.


 喜欢
喜欢
 不喜欢
不喜欢
 无所谓
无所谓
 讨厌
讨厌
 专家在线
专家在线