
 3
提交
4
提交完成
5
查看报告
6
评价
3
提交
4
提交完成
5
查看报告
6
评价
自定义题目重新选题
写作题目
收起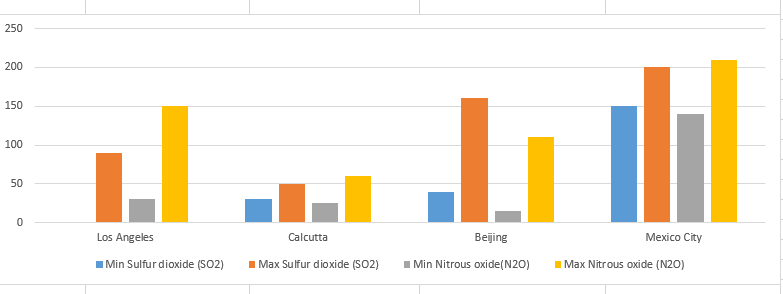
The chart shows the average daily maximum and minimum levels of two pollutants in four cities in 2000. (Unit: Micrograms per m3) PS:I memorize the chart from a real IELTS test and thus the data may not be accurate. However, I think it has shown the main characteristic of the original chart.


 喜欢
喜欢
 不喜欢
不喜欢
 无所谓
无所谓
 讨厌
讨厌
 专家在线
专家在线