 3
提交
4
提交完成
5
查看报告
6
评价
剑7 Test 2 小作文题目重新选题
写作题目
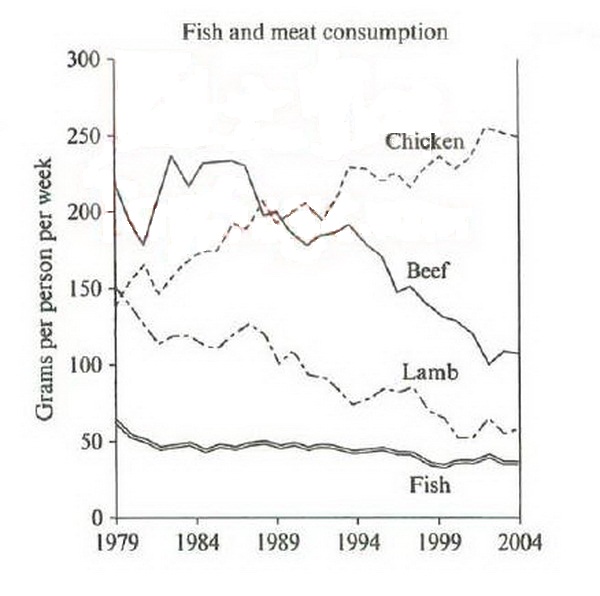
收起The graph below shows the consumption of fish and some different kinds of meat in a European country between 1979 and 2004.

Summarise the information by selecting and reporting the main features, and make comparisons where relevant.
答题辅导
收起1. 图表类型:四条线的曲线图(four-line graph / line chart)
2. 描述重点:宏观——对四条线(肉的消耗量)进行横向比较;微观——每条线的纵向变化(微观特征)
3. 主体段时态:一般过去时
描述beef, lamb和fish的变化
描述chicken


 喜欢
喜欢
 不喜欢
不喜欢
 无所谓
无所谓
 讨厌
讨厌
 专家在线
专家在线