 3
提交
4
提交完成
5
查看报告
6
评价
剑7 Test 3 小作文题目重新选题
写作题目
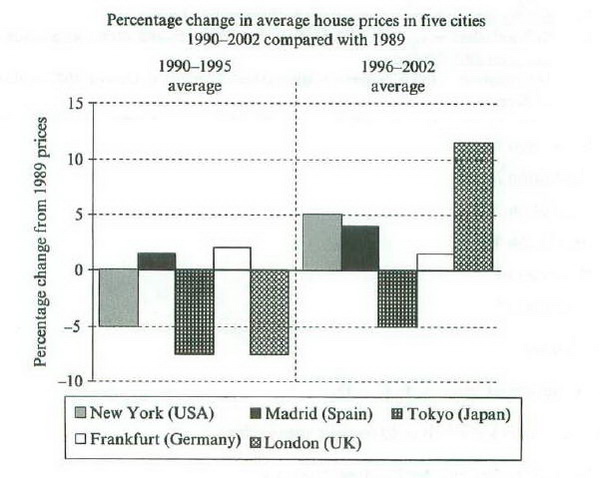
收起The chart below shows information about changes in average house prices in five different cities between 1990 and 2002 compared with the average house prices in 1989.

Summarise the information by selecting and reporting the main features, and make comparisons where relevant.
答题辅导
收起1. 图表类型:柱状图 (bar chart)
2. 重点:两个不同时段,与1989年的动态比较
3. 主体段时态:一般过去时
描述1990-1995年的情况
描述1996-2002年的情况


 喜欢
喜欢
 不喜欢
不喜欢
 无所谓
无所谓
 讨厌
讨厌
 专家在线
专家在线