 3
提交
4
提交完成
5
查看报告
6
评价
剑7 Test 4 小作文题目重新选题
写作题目
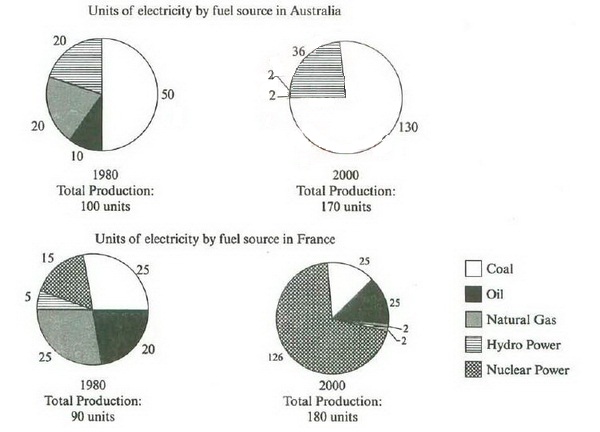
收起The pie charts below show units of electricity production by fuel source in Australia and France in 1980 and 2000.

Summarise the information by selecting and reporting the main features, and make comparisons where relevant.
答题辅导
收起1. 图表类型:饼状图(pie charts)
2. 描述重点:1980年——静态思路;2000年——动态对比
3. 主体段时态:一般过去时+过去完成时
描述饼图一,Australia的情况
描述饼图二,France的情况


 喜欢
喜欢
 不喜欢
不喜欢
 无所谓
无所谓
 讨厌
讨厌
 专家在线
专家在线