
 3
提交
4
提交完成
5
查看报告
6
评价
3
提交
4
提交完成
5
查看报告
6
评价
自定义题目重新选题
写作题目
收起The line chart below shows what percentage of people in the UK in different age group went to the cinema once a month or more between 1984 and 2003.
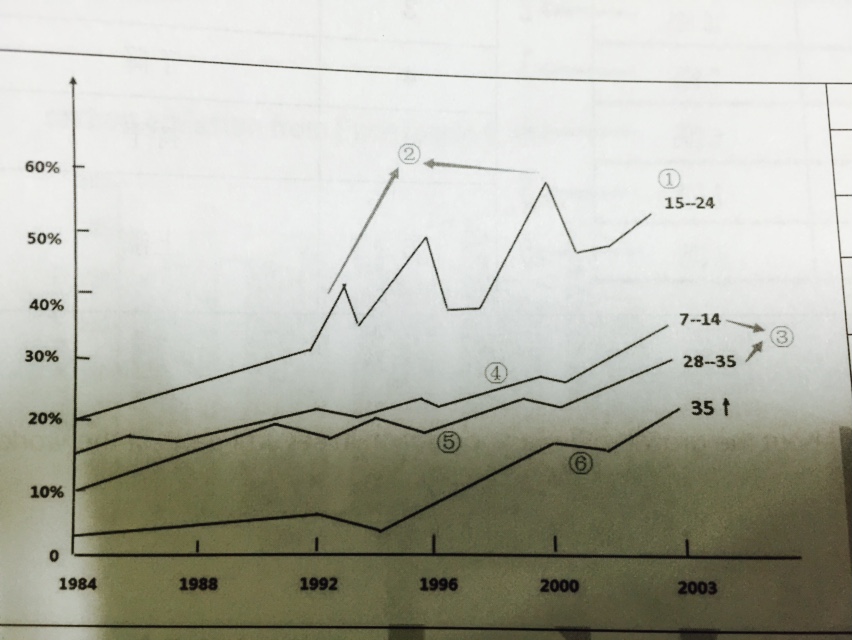
Summarise the information by selecting and reporting the main features, and make comparisons where relevant.


 喜欢
喜欢
 不喜欢
不喜欢
 无所谓
无所谓
 讨厌
讨厌
 专家在线
专家在线