
 3
提交
4
提交完成
5
查看报告
6
评价
3
提交
4
提交完成
5
查看报告
6
评价
自定义题目重新选题
写作题目
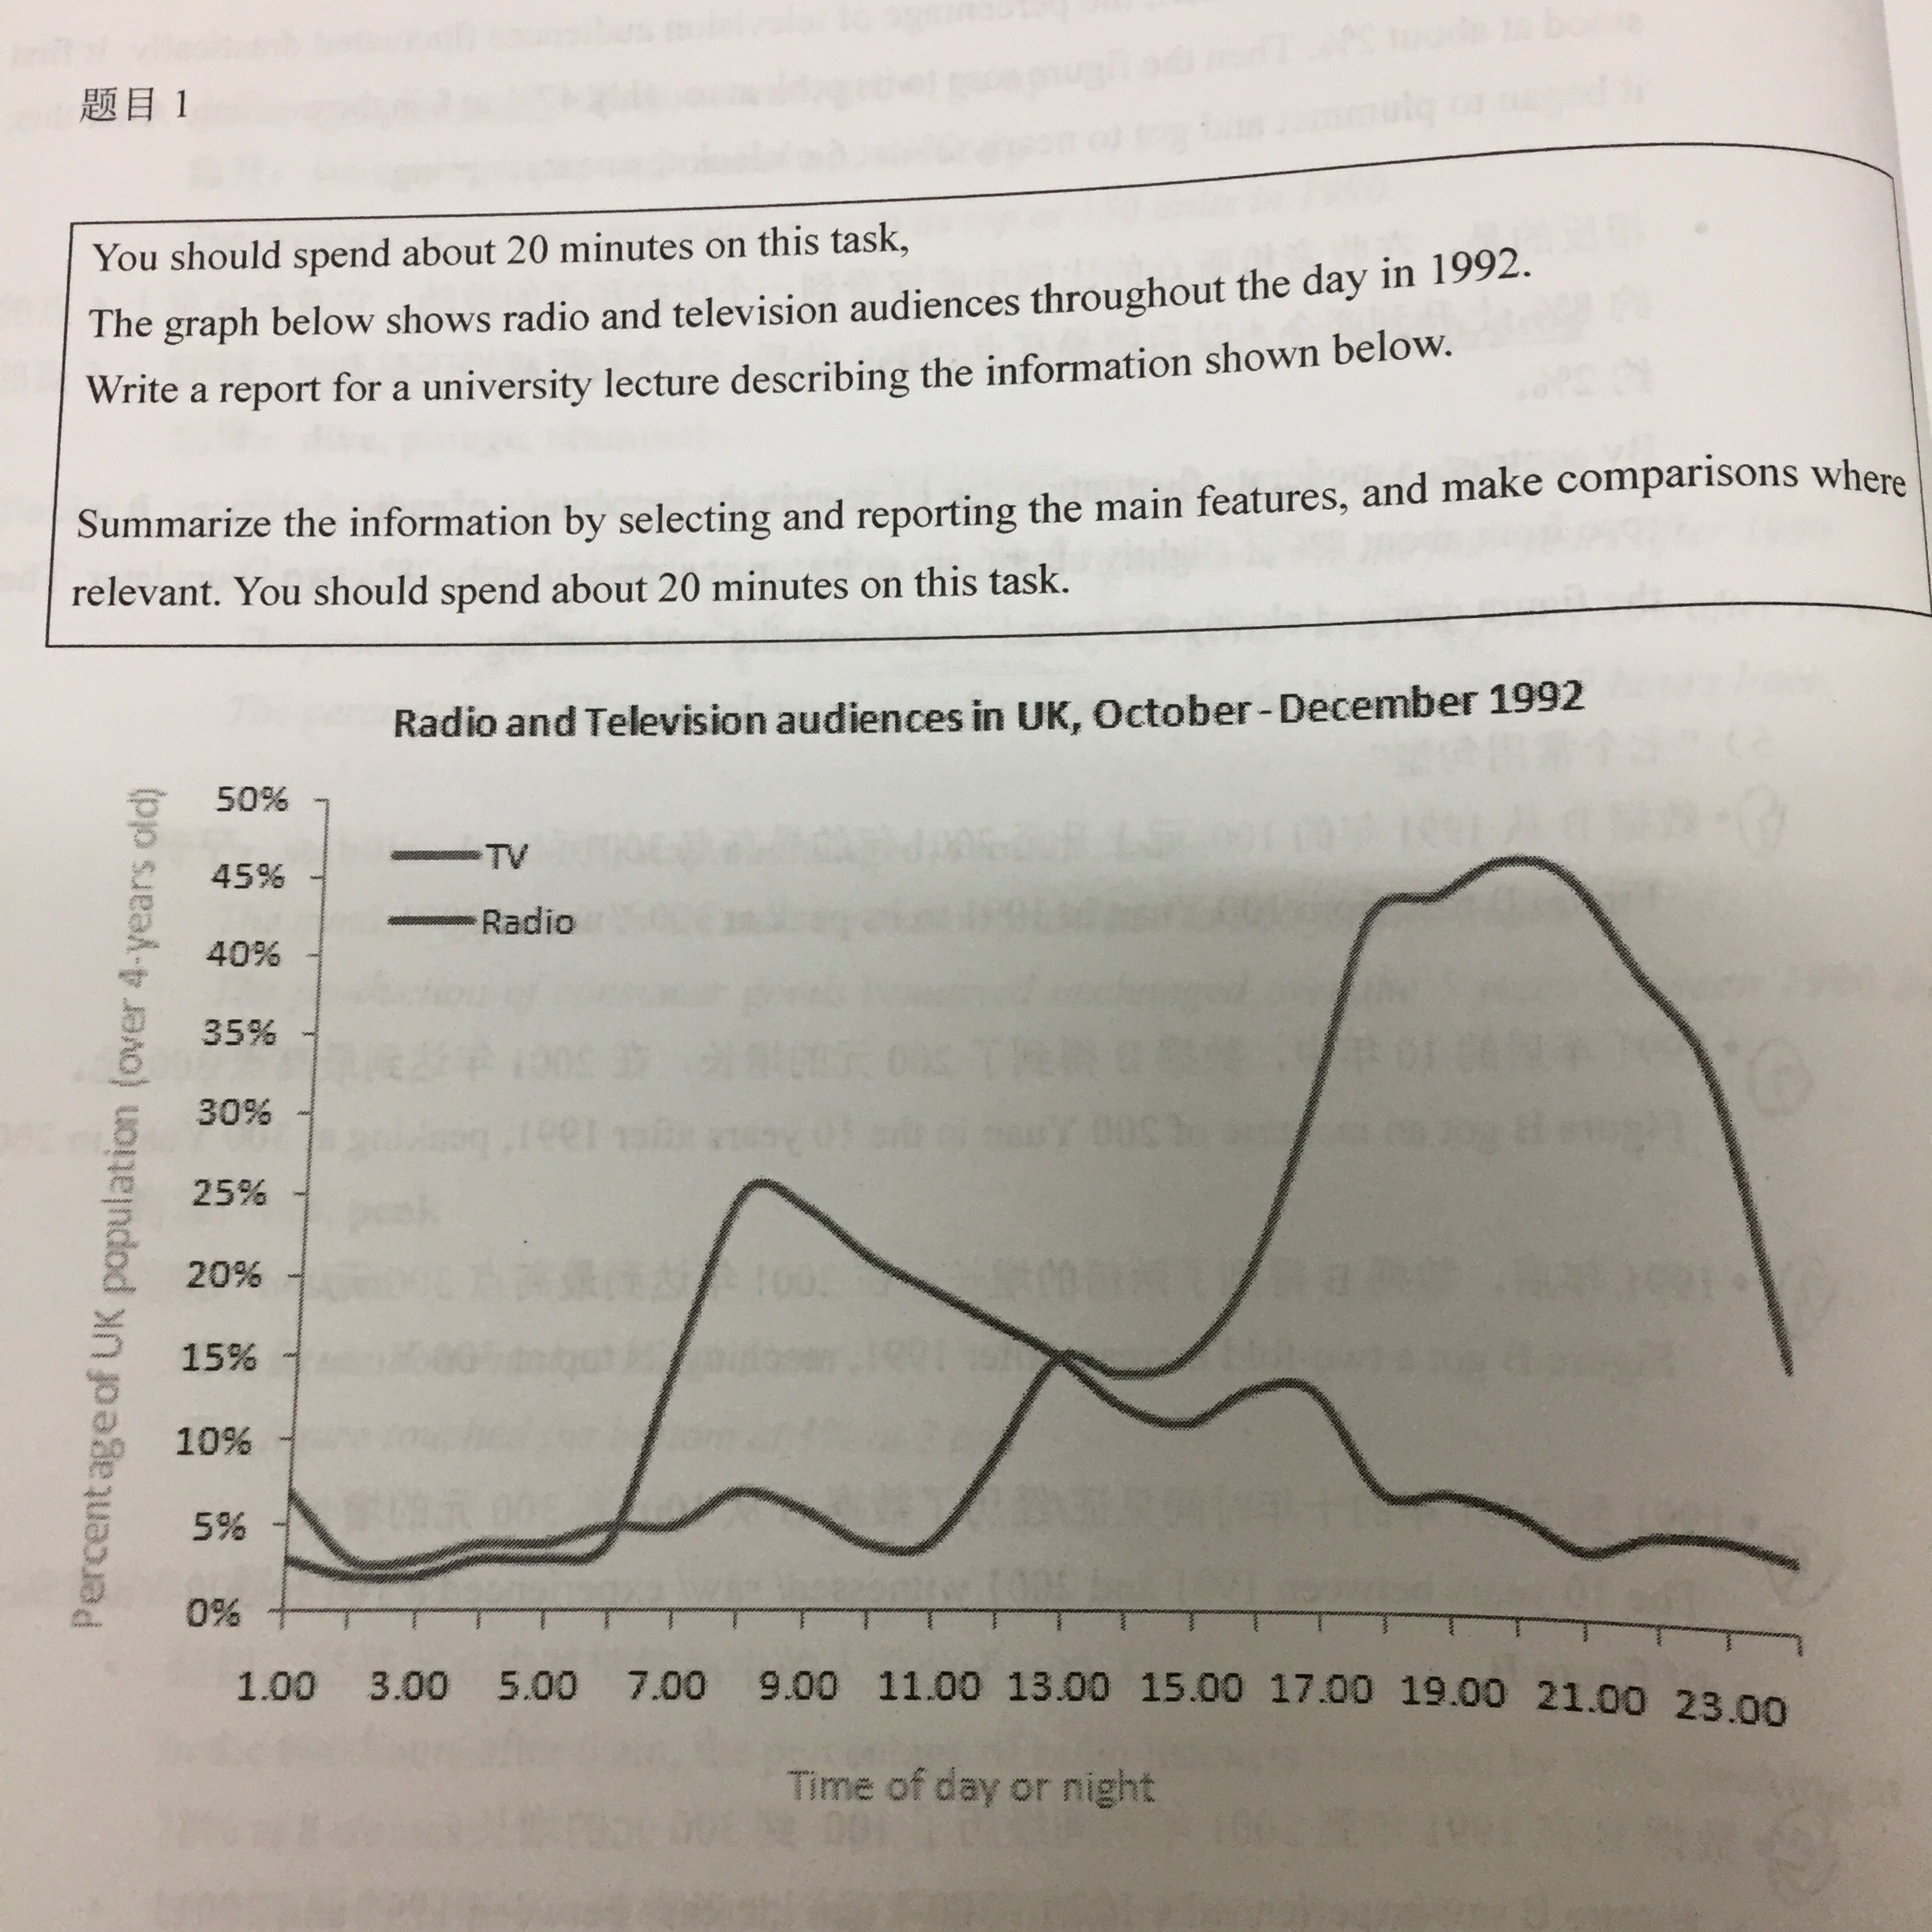
收起The line chart shows the change of radio and television audiences in UK by time of day or night from October to December 1992. It can be seen in the chart, the percentage of radio and television audiences fluctuate in different way at different time.At first ,it is shown that the percentage of radio audience stay unchanged (around 4%) until 6 am. And then ,after 6am,it increased dramatically at amount 25% at 8 am. In the following time ,the figure began to drop obviously after 8 am, and in the rest of the whole day, it shows declining tendency. The percentage of television audiences fluctuates in a drastic way . Before 11 am, that of television audiences stablize approximately 5% for 11 hours, and then the figure began to soar and reach its peak at amount 47% at 8 pm . Finally , it dropped sharply from 47% to 15% at 12 pm. To sum up, there has two crossover points with the two lines. At the first point, the percentage of radio audiences higher than that of television audiences at 6 am. And the second point ,amount 1 pm ,the former was less than the letter.
the graph below shows radio and television audiences throughout the day in 1992


 喜欢
喜欢
 不喜欢
不喜欢
 无所谓
无所谓
 讨厌
讨厌
 专家在线
专家在线